
Knocking 10,000 doors feels like momentum. It looks great on a report. But if your contact rate is sitting at 8% and your conversion rate is near zero, all that effort is theater, not strategy. Vanity metrics and impact metrics are fundamentally different animals, and in 2026, progressive campaigns that cannot tell them apart will waste resources, burn out organizers, and lose races they should have won. This guide breaks down exactly which metrics predict real voter movement and how to build a measurement system that translates outreach into electoral wins.
Table of Contents
- Why vanity metrics fall short in 2026 campaigns
- The essential impact metrics for progressive campaigns
- Measuring media spend: Advanced ad and TV metrics
- Hidden pitfalls and the future of campaign measurement
- Why smarter metrics—not more data—win elections
- Ready to transform your campaign with metrics that matter?
- Frequently asked questions
Key Takeaways
| Point | Details |
|---|---|
| Focus on impact metrics | Tracking how many minds change or actions are taken beats counting raw effort. |
| Use experiment-driven measurement | Randomized tests like RCTs reveal what actually persuades voters, not just what correlates. |
| Watch for approval fatigue | Too much outreach lowers effectiveness; manage frequency and consent closely. |
| Benchmark your media spend | Use clear CTV and brand lift targets to ensure your advertising actually helps you win. |
Why vanity metrics fall short in 2026 campaigns
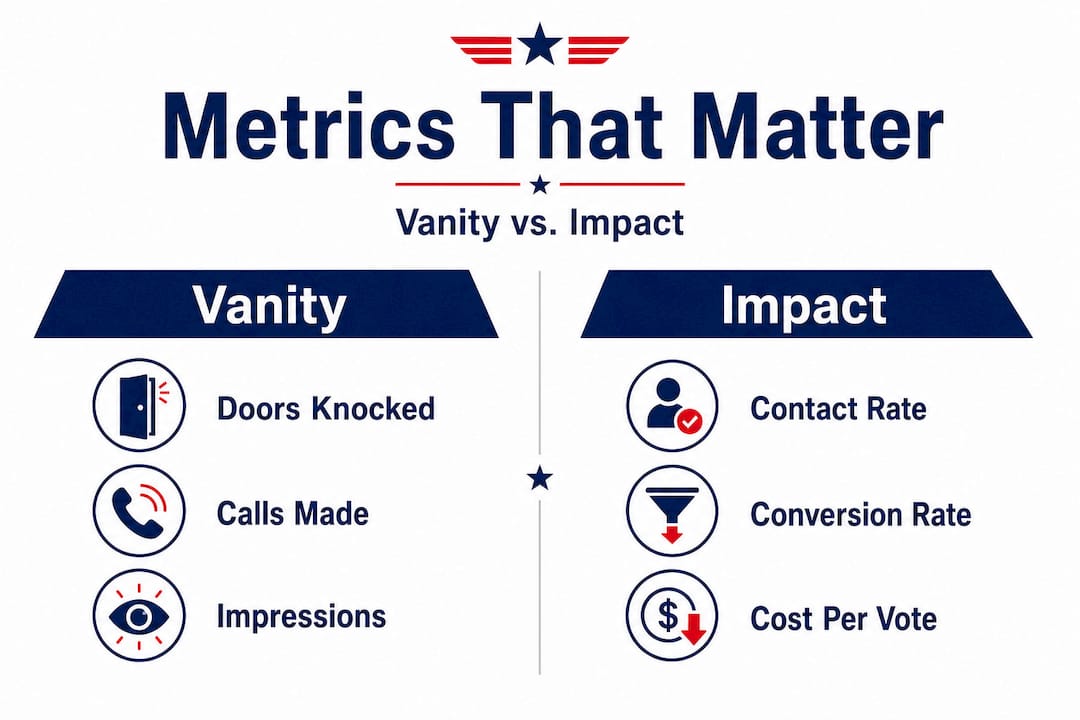
Most campaign dashboards tell a flattering story. Doors knocked: 15,000. Calls made: 8,400. Impressions served: 2.1 million. These numbers feel meaningful. Printed on a weekly report, they signal hustle and dedication. The problem is they measure output, not outcome, and that distinction is what separates campaigns that win from campaigns that almost won.
Output versus outcome metrics in political campaigns works like this: output metrics count the activity, while outcome metrics measure the change that activity produced. Total doors knocked is an output. The percentage of those knocks that produced a genuine conversation is an outcome. The percentage of conversations that ended with a volunteer pledge or a commitment to vote is an even stronger outcome. The latter two tell you whether your strategy is working. The first only tells you whether your staff showed up.
Here is a side-by-side comparison to make this concrete:
| Metric type | Example metric | What it measures | Strategic value |
|---|---|---|---|
| Vanity / output | Total doors knocked | Volume of activity | Low |
| Vanity / output | Total impressions | Ad delivery | Low |
| Impact / outcome | Contact rate | Conversations per knock | High |
| Impact / outcome | Conversion rate | Pledges per conversation | High |
| Impact / outcome | Cost Per Persuadable | Budget efficiency | Very high |
| Impact / outcome | Persuasion lift | Actual mind changes | Very high |
The field data from recent cycles backs this up hard. 2025 pilot programs run by coalition organizers showed declining contact rates even as raw output numbers hit record highs. Teams knocked more doors than ever before and reached fewer voters than the cycle prior. The DNC's 2026 organizing blueprint now emphasizes listening-first tactics and coalition-based outreach, specifically because the volume-first model was producing exhausted organizers and weak results.
Key impact metrics every progressive field director should be tracking:
- Contact rate: Conversations divided by total knocks or calls. A healthy field contact rate typically falls between 15% and 30% depending on district density and time of day.
- Conversion rate: Pledges or commitments divided by total conversations. This tells you whether your message is landing.
- Persuasion lift: The measured shift in voter support before and after targeted outreach. Requires a test/control design.
- Cost Per Persuadable (CPP): Budget spent divided by the number of persuadable voters meaningfully reached.
- Cost Per Vote: Total spend divided by votes gained. The ultimate efficiency measure in competitive races.
"High output without meaningful contact is not organizing. It is motion. Campaigns that win in 2026 will be the ones that measure the difference."
The shift toward data-driven campaign momentum is not optional anymore. It is the baseline expectation in any serious progressive operation heading into 2026.

The essential impact metrics for progressive campaigns
Now that we know what to watch out for, here's how to choose and use the campaign metrics that actually predict victory. Let's go through the five most important impact metrics, how to calculate them, and when to use each one.
1. Contact rate Formula: Total meaningful conversations divided by total attempts (knocks, calls, or texts). If your canvassers knocked 400 doors and had 80 real conversations, your contact rate is 20%. Anything below 12% on doors should trigger a review of your turf, timing, or canvasser training.
2. Conversion rate Formula: Commitments received divided by total conversations held. If those 80 conversations produced 24 voter pledges, your conversion rate is 30%. This metric is your message quality signal. Low conversion usually means your pitch needs work, not that you need more volunteers.
3. Cost Per Persuadable (CPP) Formula: Total program spend divided by the number of persuadable voters reached with a meaningful touch. This requires that you define "persuadable" in advance using your voter file and targeting criteria. A well-run direct mail and canvassing combo might achieve a CPP between $8 and $18 in a competitive state legislative race.
4. Cost Per Vote Formula: Total campaign expenditure divided by net votes gained compared to a baseline or control group. This is the macro efficiency number most campaigns calculate only at the end of a cycle. Smart campaigns build this estimate into their planning from the start.
5. Persuasion lift This one requires an experimental design. You need a treatment group that receives your outreach and a control group that does not. Survey both before and after. The difference in candidate favorability or vote intention between the two groups is your persuasion lift. This is the only honest way to know if your message actually changed minds.
Impact metrics like Cost Per Persuadable and Uplift Modeling via randomized controlled trials (RCTs) are now considered essential tools for measuring true voter persuasion, not just activity volume.
Here is a sample calculation table to make this actionable:
| Metric | Inputs | Calculation | Result |
|---|---|---|---|
| Contact rate | 600 knocks, 102 conversations | 102 / 600 | 17% |
| Conversion rate | 102 conversations, 38 pledges | 38 / 102 | 37% |
| Cost Per Persuadable | $4,200 budget, 210 persuadables reached | $4,200 / 210 | $20 per persuadable |
| Persuasion lift | 8% support in control, 14% in treatment | 14% minus 8% | 6 point lift |
The process for building impact metric discipline into your weekly field reporting looks like this:
- Define your two core metrics before the week starts (usually contact rate and conversion rate).
- Build those fields into your canvassing app or call sheet.
- Review results by turf, by canvasser, and by time block every 48 hours.
- Adjust training, turf assignment, or messaging based on what the data shows.
- Document your changes so you can test whether the adjustment worked.
Pro Tip: Start every weekly canvassing debrief with exactly two numbers: contact rate and conversion rate. If your team cannot recall both without looking them up, they are not using them to drive decisions.
You can explore metrics frameworks for modern campaigns that align field data with strategic goals throughout your entire campaign cycle.
Measuring media spend: Advanced ad and TV metrics
With field and volunteer metrics covered, let's tackle how to measure the powerful and expensive world of paid media. Digital and TV advertising represents a major share of most campaign budgets. Without the right measurement approach, you are essentially flying blind with someone else's money.
The most important benchmarks for connected TV (CTV) and digital advertising in 2026:
- Frequency: Optimal CTV exposure is 8 to 12 impressions per household. Below 8 and awareness rarely sticks. Above 12 and you risk fatigue without additional persuasion benefit.
- Completion rate: Aim for 90% or higher on video completions. Lower rates suggest mismatched targeting or poor creative execution.
- Name recognition lift: A well-targeted TV flight should produce a 10 to 20 point lift in candidate name recognition.
- Branded search increase: Expect a 30% or greater increase in branded search volume during and immediately after a TV buy.
- Website traffic lift: A well-coordinated digital and TV push typically drives a 15% to 30% increase in organic and direct site traffic.
How to build media ROI measurement without a $50,000 research budget:
- Run a short pre-flight survey in your target districts. Keep it to 5 questions: name recognition, favorability, top issue priority, vote intention, and party ID.
- Define a test zone (districts where ads run) and a comparable control zone (similar districts where ads do not).
- Run a post-flight survey in both zones 10 to 14 days after your buy ends.
- Compare shifts in name recognition and favorability between test and control.
Multi-touch attribution beats last-click measurement every time. A voter who sees a TV ad, receives a piece of mail, and gets a door knock before committing to vote should not have that conversion credited only to the final touch.
Pro Tip: If you can only afford one research tool for your media measurement, invest in an inexpensive automated post-call survey tied to your voter file. Match survey responses to ad exposure records and you have a real attribution model.
You can connect this approach to broader campaign ad ROI analysis by syncing your media data with field contact records, giving you a complete picture of each voter's exposure and response history.
Hidden pitfalls and the future of campaign measurement
Even with a solid metric foundation, pitfalls remain. Here's what you need to know to avoid common traps and stay ahead in 2026.
The biggest measurement trap right now is over-solicitation. Approval fatigue from excessive outreach measurably depresses response rates, particularly in text and email programs. When a voter receives a text every other day for three weeks, they stop opening them. Your open rate collapses, your conversion drops, and your cost per contact spikes. Fatigue budgets, which set a maximum number of contacts per voter per week, are one of the most underused tools in progressive campaign operations.
Practical steps to prevent outreach fatigue:
- Set channel-specific contact caps: No voter should receive more than two texts and one email per week during non-peak periods.
- Prioritize consent signals: If a voter has previously unsubscribed or asked to be removed, scrub them immediately from future lists.
- Monitor open and response rate trends: A drop of more than 10% week over week is a fatigue signal, not a targeting problem.
- Build a suppression list protocol: Automate the process of flagging fatigued contacts so organizers do not accidentally re-contact them.
On the experimental side, RCTs (randomized controlled trials) remain the gold standard for causal measurement. Traditional support scores mix persuadables with unknowns, which makes it nearly impossible to know whether your outreach changed a mind or simply contacted someone who was already planning to vote for your candidate. Uplift modeling addresses this by identifying voters whose support is genuinely movable versus those who are solid regardless of contact.
One nuance that many campaign guides skip entirely: large-scale meta-analyses of voter contact programs have found a near-zero average persuasion effect across many studies. This sounds alarming, but it actually tells you something useful. The average hides enormous variation. Some programs produce dramatic persuasion lifts. Others produce nothing. The difference is usually in targeting precision, message relevance, and timing. Running rapid experiments using tools for fatigue management and uplift modeling lets you find the approaches that actually work in your specific district and demographic context.
Why smarter metrics—not more data—win elections
Here is something most metrics guides will not tell you: the problem in progressive campaign data culture is not a shortage of data. It is an obsession with collecting more of it while failing to act on any of it. Field teams are reporting into spreadsheets that nobody reviews. Ad dashboards run on autopilot. Organizers are evaluated on volume because volume is easy to count and impact is harder to explain.
The volume obsession has a second-order cost that rarely gets discussed: organizer burnout. When your team believes their job is to knock 300 doors a day regardless of contact rate, they are optimizing for the wrong thing and wearing themselves out doing it. Burnout is expensive. Replacing a trained field organizer mid-cycle is one of the most disruptive events a campaign can experience.
True measurement discipline in 2026 means choosing fewer metrics and acting on them faster. It means designing experiments before you launch programs, not after. It means being willing to cut a program that looks busy but produces no measurable persuasion lift, even when that is politically uncomfortable inside your own campaign.
Here is the contrarian warning worth repeating: no tool replaces judgment. Campaign Buddy HQ and every other platform out there gives you the infrastructure to track what matters. But the discipline to build momentum with smarter metrics comes from campaign leadership deciding in advance what winning looks like, and measuring only what brings you closer to that definition. Track what changes minds. Measure what moves votes. Let go of everything that just makes the report look full.
Ready to transform your campaign with metrics that matter?
Building an impact-first measurement culture does not require a data science team or a six-figure analytics budget. What it requires is the right system for logging outreach, tracking progress, and spotting patterns before they become problems.
Campaign Buddy HQ is built exactly for this. You can log doors, calls, texts, and registrations in real time, monitor your contact and conversion rates by canvasser and turf, and track progress toward your phase goals all in one place. Use the free campaign budget template to align your spending with your highest-impact programs, and run the how many voters to win calculator to set realistic targets from day one. The free 7-day trial requires no credit card, so there is no reason to keep managing your outreach in disconnected spreadsheets.
Frequently asked questions
What is the difference between a vanity metric and an impact metric in campaigns?
Vanity metrics measure activity volume such as total doors knocked or impressions served, while impact metrics track actual voter persuasion or movement, like contact rate, conversion rate, or persuasion lift. Only impact metrics tell you whether your outreach is actually working.
Which campaign metric predicts voter turnout most accurately in 2026?
Contact rate and conversion rate, combined with experimental methods like RCTs or uplift modeling, best predict true voter movement because they measure real engagement and causal persuasion rather than outreach volume alone.
How can I avoid approval fatigue with my voter outreach?
Set channel-specific contact frequency limits, implement fatigue budgets, and use consent-first telemetry to prevent over-solicitation. Monitoring weekly response rate trends will give you an early warning signal before fatigue becomes a serious problem.
What are realistic benchmarks for TV and digital ad campaigns in 2026?
Target 8 to 12 ad impressions per household, video completion rates above 90%, and a 10 to 20 point lift in name recognition to indicate that your paid media is generating real impact rather than just burning budget.